This post is part of a series of case studies developed with utility partners and the WUCA Equity Subcommittee to spotlight practical climate approaches and lessons from the field. Below is an abridged version; for the full narrative and details, download Climate Investments that Support Underserved Communities.
As climate change and extreme weather events damage and reshape our communities, these impacts are felt unequally. Those most at risk—such as low-income households, communities of color, and individuals with limited access to education, healthcare, and stable housing—face disproportionate and lasting impact. Social and economic disparities not only increase their vulnerability but also restrict their ability to prepare for, respond to, and recover from climate and extreme weather threats, further deepening existing injustices (Shonkoff et al., 2011). To address these inequities, level the playing field for recovery, and build resilience to climate-related impacts, historically disinvested and overlooked communities require targeted investments in climate adaptation.
The following case studies highlight utilities that implement data-driven, community-informed strategies to bridge historical investment gaps and support those most vulnerable to the impacts of climate change. By examining real-world applications of these principles, this study provides a roadmap for investors, policymakers, and community leaders.
Examples of Water Utility Climate Investments that Support Underserved Communities
Harnessing stormwater solutions to protect communities most at-risk
In 2023, New York City invested $400 million in the Department of Environmental Protection’s (DEP) Cloudburst Program, a form of stormwater management developed to mitigate flood risks from extreme rainfall events through a combination of grey and green infrastructure, building upon DEP’s existing Green Infrastructure Program.
Since its introduction, the Cloudburst Program has been an example of climate investment in underserved and at-risk neighborhoods, engaging community participation to guide Cloudburst project design and aligning stormwater infrastructure improvements with public amenities.
Background
DEP initiated its Green Infrastructure Program in 2010 to enhance water quality and improve stormwater management. To date, the program has implemented over 16,000 green infrastructure projects, with more projects underway. These projects integrate sustainable stormwater solutions into streets and public spaces. The Cloudburst Program builds upon the Green Infrastructure Program, introducing a toolkit of networked stormwater solutions that target flooding hotspots and enhance public spaces.
The Cloudburst Program was initiated in 2015 as a partnership between New York City and the City of Copenhagen, leveraging Copenhagen’s expertise in mitigating flood risks from heavy rainfall events. A Cloudburst Resiliency Planning Study assessed the feasibility of implementing these strategies in the city, leading to targeted investments in stormwater infrastructure. The program was driven by a proactive approach to understanding future flood risks and ensuring the city was prepared for major climate events.
In May 2021, the DEP published its first Stormwater Resiliency Plan. This report was compiled to outline the planning process for managing climate risks due to an increase in the magnitude and frequency of extreme rainfall. Through effective stormwater planning, DEP aims to mitigate climate risk by alleviating flooding, particularly in vulnerable areas.
The Stormwater Resiliency Plan included a series of stormwater flood maps, born out of initial studies and analyses performed to better understand the potential impacts of heavy rainfall throughout the city. The maps, which comprised future modeling scenarios, were a collaborative effort involving multiple agencies, academic partners, and consulting teams. The resulting public maps were a first for the city.
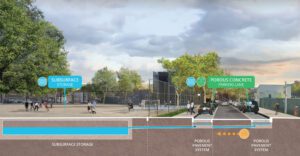
Image courtesy of NYC DEP
Expansion of Cloudburst Program
In September 2021, Hurricane Ida hit New York City, causing devastating flooding. This reinforced the need for continued substantial investment in flood mitigation and improved stormwater management. The aftermath of the storm led to a significant increase in funding, with an additional $400 million allocated to expand the Cloudburst Program in 2023.
Due to previous investments in flooding vulnerability assessments, DEP had already laid the groundwork for understanding where to allocate these funds for effective climate risk management. The Stormwater Resiliency Plan flood maps identified vulnerable areas and showed that extreme flooding was highly likely in many parts of the city. To prioritize initial Cloudburst project locations, DEP used additional data, such as the Centers for Disease Control and Prevention’s Social Vulnerability Index, to identify high-priority areas, including those within underserved neighborhoods.
Ensuring Equitable Climate Investments
A core principle of the Cloudburst Program is its dual-purpose design, which integrates stormwater management with public space improvements. Community engagement is central to the program, ensuring that residents have a voice in shaping their neighborhoods post-infrastructure upgrades. Examples of community-informed Cloudburst projects include enhanced playgrounds or sunken sports courts that act as retention basins during flooding events.
Community engagement encompasses both the listening and visioning phases, during which feedback is gathered on local flooding experiences, as well as on design features such as the addition of trees or alternative paving options. The design team then integrates this feedback into the project plans. The engagement itself also helped direct DEP investments into projects that meet both utility and community needs, providing returns on investment both for stormwater management and broader community well-being.
By embedding engagement and prioritization of underserved neighborhoods into its planning process, the Cloudburst Program not only enhances New York City’s flood resilience but also fosters stronger, more engaged communities. The initiative demonstrates how climate adaptation strategies can serve both environmental and social needs.
Insights
- Use data to guide equitable investments: Local, up-to-date data allows for the identification of communities that have been historically underinvested in and face the most climate impacts, ensuring investments are effective and equitable.
- Early investments lead to effective disaster response. Understanding and preparing for potential climate risk can lead to effective use of funding following major disaster events.
- Invest in meaningful community engagement: Allocate funding and design engagement practices to foster early and meaningful community involvement, ensuring that resident input shapes the project to meet both utility and community needs.
- Create public spaces that serve dual functionality. Stormwater management can exist in harmony with community needs. As you invest in improved water infrastructure, seek opportunities to redesign public spaces in ways that meet community needs and reduce flood risk.
Prioritizing Resource Distribution to Environmental Justice Communities: San Francisco Public Utilities Commission
Mapping environmental justice communities to guide climate investments
The San Francisco Public Utilities Commission (SFPUC) prioritizes fair and inclusive outcomes in its climate investments. This commitment is guided by a series of foundational policies and resolutions. The agency’s 2009 Environmental Justice Policy aims to prevent and address environmental harm that disproportionately affects specific communities. Its 2011 Community Benefits Policy takes a “triple bottom line” approach, ensuring that environmental protection, economic opportunity, and social well-being are considered together. Most recently, the 2020 Racial Justice Resolution reaffirms the agency’s commitment to addressing racial disparities in the distribution of resources and the delivery of programs. These longstanding commitments have helped build a culture that integrates fairness and responsiveness into decision-making across the organization.
To support this work, the SFPUC uses an Environmental Justice (EJ) Communities Map to identify neighborhoods that face greater environmental burdens and socioeconomic challenges. Developed by San Francisco Planning in collaboration with multiple departments and adopted in 2023, the map builds on California’s CalEnviroScreen tool and enhances it with local data informed by public input. This localized approach provides a more accurate picture of community conditions in San Francisco, helping guide the agency’s resource allocation, outreach efforts, and impact measurement.
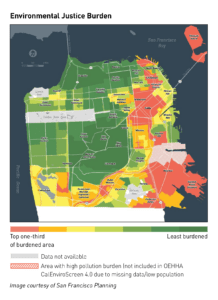
Image courtesy of San Francisco Planning
EJ Communities Map in Action
The EJ Communities Map plays a central role in how the SFPUC prioritizes infrastructure and program investments, especially in neighborhoods that are more exposed to environmental risks and have historically received fewer public resources. Agency departments use the map to ensure their projects not only meet technical standards but also provide meaningful benefits to communities that need them most.
Water Conservation
The SFPUC’s water conservation program helps residents use water efficiently and lower utility costs, which is particularly valuable for lower-income households. The agency utilizes the EJ Communities Map to evaluate the effectiveness of these programs in reaching communities with limited financial resources or language barriers. Program staff compare the locations of participants with the map to identify areas where outreach or support may need improvement. As a result of this analysis, free incentive programs, such as water audits and the installation of water-saving devices, are more frequently delivered in neighborhoods with lower median incomes and higher concentrations of non-English speaking residents. These efforts reduce household water bills, promote more sustainable water use, and support long-term system resilience.
Green Infrastructure
The SFPUC’s stormwater management strategy includes building green infrastructure, such as rain gardens and permeable pavement, to reduce flooding and sewer overflows. While technical criteria help determine project locations, the agency also uses the EJ Communities Map to prioritize improvements in neighborhoods that have experienced chronic underinvestment. These areas often face greater risks from outdated infrastructure and are more vulnerable to the effects of extreme weather.
Through its Green Infrastructure Grant Program, the agency supports community-led stormwater projects that offer additional benefits like increased green space and improved air quality. Schools and parks in underserved neighborhoods are among the key beneficiaries. The program promotes inclusion throughout its process: the application criteria reflect the agency’s environmental justice policy, outreach materials are offered in multiple languages, and applicants can receive early-stage funding and project planning support. These features reduce barriers to participation and increase the likelihood that communities most affected by climate change can take advantage of available resources.
Importantly, the agency recognizes that maps alone cannot define what environmental justice means for every neighborhood. Applicants are encouraged to describe the specific conditions in their community and explain the importance of their project. Overall, these efforts have resulted in more applications and greater investment in neighborhoods with clear environmental and infrastructure needs.
Climate Action Plan and Water Supply Equity
The EJ Communities Map also informs how the SFPUC integrates fairness and inclusion into its long-term water supply planning, particularly through its Climate Action Plan. During the plan’s development, staff also used San Francisco Environment’s Racial and Social Equity Assessment Tool (RSEAT) to evaluate how proposed strategies might impact different communities. This process led to the development of specific equity metrics to track whether programs are reaching households facing financial strain or language access barriers, and whether infrastructure upgrades are being equitably distributed.
These equity metrics—such as the number of projects implemented in underserved neighborhoods or the percentage of households reached through targeted outreach—enable the agency to measure the effectiveness of its programs and initiatives in serving EJ communities and adjust its approach over time. This systematic tracking, through the use of the EJ Communities Map, helps ensure that communities with the greatest needs are not left behind and that planning processes are responsive to long-standing disparities.
One example of this approach is the SFPUC’s process for planning purified water projects. Purified water presents an opportunity to increase the reliability of drinking water deliveries, particularly during critical times of drought when other supplies may be limited. However, implementing purified water projects requires the construction of new treatment and pipeline infrastructure near existing sources of recycled water.
While the southeast side of the city currently treats the majority of the city’s wastewater, the project team is considering building two plants, one on each of the east and west sides of the city, to ensure equitable distribution and the associated benefits of the PureWaterSF program.
Sensitive to the fact that southeast communities have historically borne a disproportionate share of infrastructure impacts, the SFPUC plans to actively partner with residents and businesses on project planning, design, and implementation. Additionally, the agency will collaborate with local communities to deliver broader benefits, including workforce training and local job creation, to the area.
Conclusion
The SFPUC continues to use data, community input, and deliberate planning to close historical investment gaps and support neighborhoods most affected by environmental harm and climate change. By institutionalizing policies that promote fairness, investing in tools like the EJ Communities Map, and embedding public engagement in planning and implementation, the agency is working to ensure that climate resilience reaches those who have too often been overlooked.
Insights
- Create clear policy foundations. Strong agency policies around environmental justice and affordability ensure that fair and inclusive practices are embedded in all programs and operations—not just short-term initiatives. These policies provide continuity over time, even as staff or leadership changes.
- Use data to guide investments. The EJ Communities Map, developed through interdepartmental collaboration, helps the agency identify neighborhoods facing the greatest environmental burdens and directs investments where they are most needed.
- Understand and reflect community realities. Reliable local data and demographic analysis enable the agency to tailor its communication and services to match the specific needs of the populations it serves.
- Engage early and often. Building relationships with communities from the beginning of a project creates opportunities for trust, input, and mutual understanding. Early engagement leads to more thoughtful and responsive project design.
The US Water Alliance is especially grateful to the New York City Department of Environmental Protection and the San Francisco Public Utilities Commission for lending their time to share project insights and provide review support. Gratitude goes to the WUCA Equity Subcommittee.